Vevox Presenter Guide
When you start your Vevox poll and hover over the screen, a control bar appears at the bottom. On the right hand side you will see further options on the different ways you can display the results of the poll. This guide will run through all the available buttons in this view.
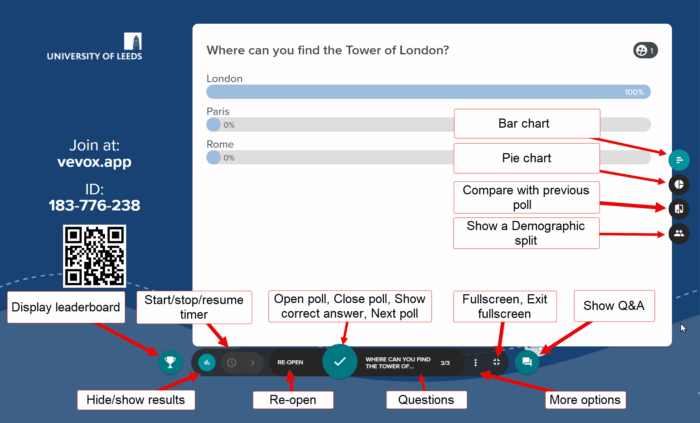
Open poll, Close poll, Show the correct answer, Next poll
This central button allows you to open the poll, close the poll question, show the correct answer and move on to the next poll.

The Show the correct answer button displays the current results of a poll to the audience. It allows the presenter to reveal the collected data and engage the audience by showing the collective responses or opinions.
Leaderboard and Team Leaderboard

It is possible to gamify your Vevox poll by displaying a leaderboard of how the participants are doing in the quiz. This is enabled by default. Please note, the leaderboard will only display scores and rankings when polls have correct answers assigned to them and they have been presented. You can choose to show the leaderboard after every question or at the end, or not display it at all. See more on showing a leaderboard to participants. (Links to Vevox helpsite).
There is now an option to create a Team leaderboard in Vevox. The team leaderboard tracks the performance of the Teams and ranks them according to their quiz scores. Please see our guide on setting up a Team Leaderboard.
Speed scoring
In the event of a draw, you can use the speed leaderboard to break a tie. Speed scoring must be enabled within your settings of your Vevox poll to see this option on your presenter dashboard. The speed leaderboard will determine a winner based on response time. Please note: speed scoring only works with standard/individual and not Team leaderboards. See more on displaying speed scoring and how to set it up (Links to Vevox helpsite).
Start/stop/resume timer and time adjustment
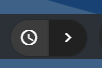
If you would like to add a timer to your poll whilst you are presenting, you can select onto the Time adjustment button and add a timer from here.

Fullscreen/Exit fullscreen
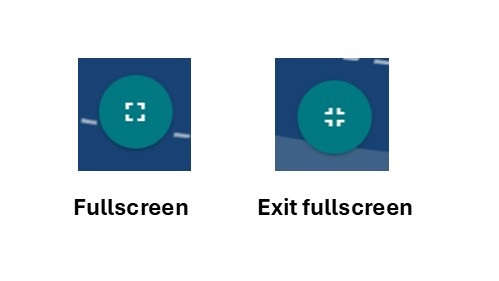
To display your poll fullscreen, select the fullscreen button and to exit fullscreen select the exit fullscreen button.
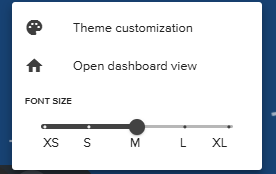
More options
![]()
The more options button allows you to make changes to the theme, open the dashboard view and adjust the font size.
Show Q&A

If you have a Q&A enabled on your poll, students can submit questions and feedback during a presentation or meeting. Attendees can ask questions, share ideas, or offer comments, and can also upvote or downvote others' submissions (where enabled), highlighting the most relevant topics for the presenter. For more information on Q&A see the What is a Vevox Q&A guide.
Bar chart and Pie chart

When you have multiple choice questions included in your Vevox poll, you can display the results as a bar chart or pie chart and switch between the two. By default, multichoice questions are shown as bar charts. Select on the Pie chart button to switch to the Pie chart view.
Compare with previous poll
![]()
The comparison poll involves asking the same question twice (or multiple times) within a session and then comparing the results. Please see the Before and After Poll comparisons on Vevox guide for further details.
Demographic split

Demographic segmentation is a method used to categorise users based on characteristics such as interests, location, year of study, department, and more. This approach allows you to gain insights into different groups. By identifying trends and gaps, and offering customised options, demographic segmentation enhances the effectiveness of communication and engagement. Please see the Demographic segmentation guide for further details.
Page last checked: April 2026