What are Engagement Ratings in StREAM@Leeds and how are they calculated? - Staff Guide
StREAM@Leeds calculates Engagement Ratings for each student based on how much they’ve interacted with key digital education systems.
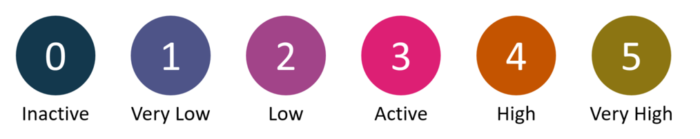
These Engagement Ratings are: Inactive (0), Very Low (1), Low (2), Active (3), High (4), Very High (5).
In addition to providing the student with insight into their digital engagement with their learning, Engagement Ratings are used to help staff identify students who may benefit from support. For example, if a student remains Inactive (0) for 7 consecutive days, functionality in StREAM@Leeds known as Notifications are then used to flag this. Learn more about Notifications.
Where do these Engagement Ratings appear?
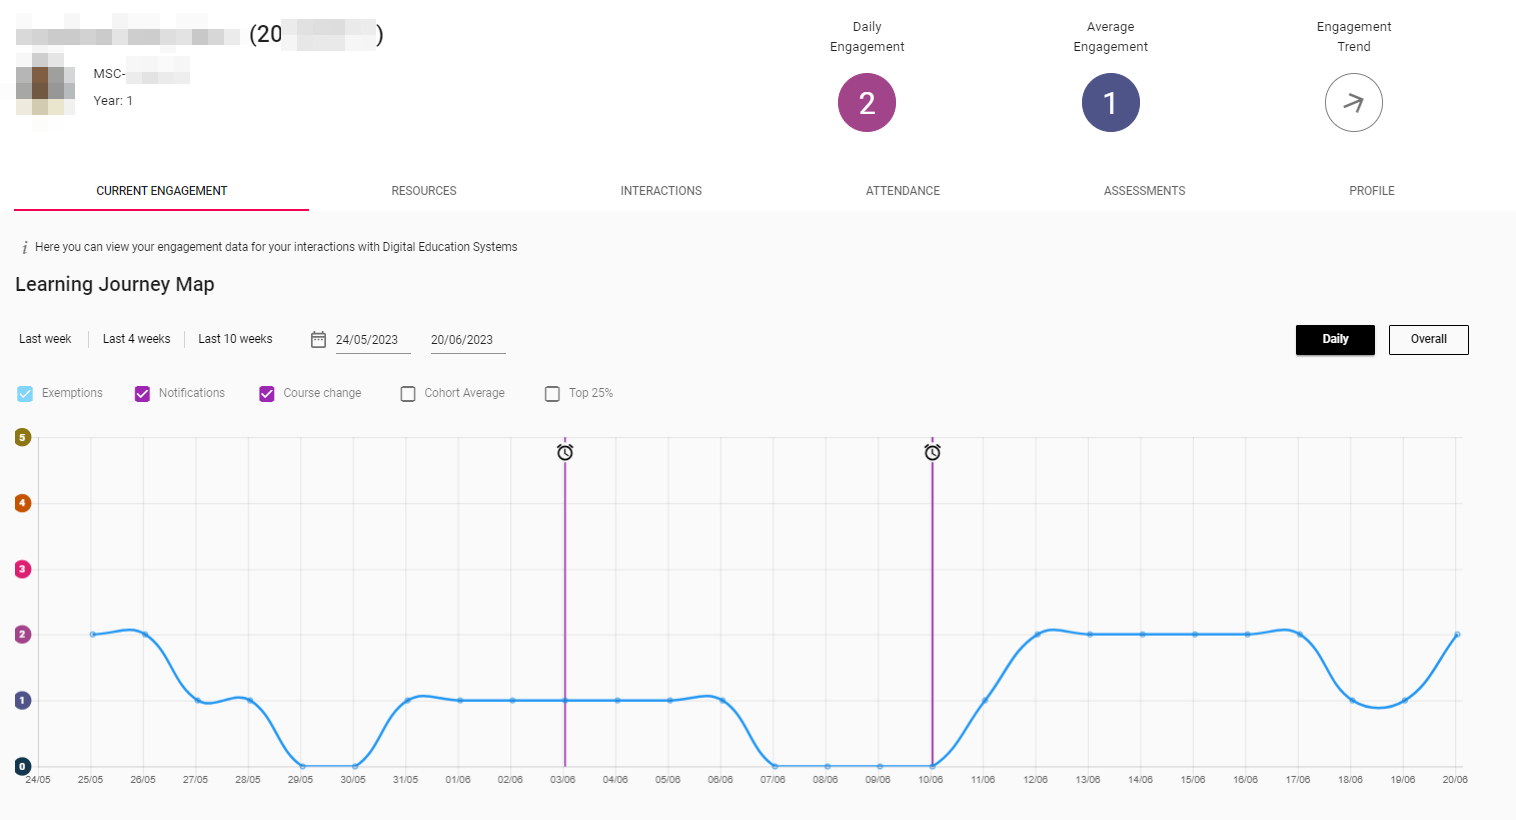
A student's Engagement Ratings (and a summary of their activity within key digital education systems) are presented to them via their StREAM@Leeds Dashboard. Their Dashboard highlights their:
- Daily Engagement Rating - this takes into account the last 7 days of digital activity for full-time students and the last 21 days for part-time students.
- Average Engagement Rating - this is the mean over 14 days for full time students.
The student's Learning Journey Map shows their Engagement Ratings across the 4 last weeks by default. The date pickers above the map can be used to change the date range visualised on the map. The Cohort Average can be toggled on to show the average engagement of students on the same programme as the selected student.
In addition to the student:
- Student Education Service staff involved in digital engagement monitoring can view StREAM@Leeds Dashboards for the students within their school and/or faculty.
- Academic Personal Tutors can see their tutees' Dashboards.
How are Engagement Ratings calculated?
Whilst Engagement Ratings are calculated on a daily basis, they consider activity from the last 7 days for full-time students and activity from the last 21 days for part-time students. This ensures that they do not fluctuate dramatically each day. For a full-time student, this means that if they have engaged at a high level between Monday and Friday but stop engaging on the weekend, they won't suddenly drop into the Inactive (0) category if they re-engage on Monday.
They are not specific to a Faculty, School or Programme. If a student's Engagement Ratings are on the lower end, this does not always mean their level of interaction is a problem. Staff considering a student's Engagement Ratings should check their Cohort average to get a sense of how the student is engaging in comparison with peers on the same programme of study.
The Cohort average shows the average engagement of students studying the same programme. This can help the student to understand where their engagement patterns differ from the rest of their cohort. This is shown to them when they view their Learning Journey Map by a red dotted line.
Students are not expected to have consistent Engagement Ratings throughout their studies. There is a natural ebb and flow to engagement and so students should not expect have the same Engagement Rating during their time at university. It is normal to move between Engagement Ratings depending on a number of factors including where they are in the academic year, the type of learning that they are doing at a particular point, and their activity with university resources.
Which systems are used to calculate Engagement Ratings?
If you are interested in which digital education systems are used to calculate Engagement Ratings see, Which digital education systems and resources are used in StREAM@Leeds.