Get started with StREAM@Leeds - Student Guide
StREAM@Leeds is the University of Leeds learning analytics system and is available to Undergraduate and Taught Postgraduate students.
StREAM@Leeds collects and analyses data on your usage of key digital education systems such as Minerva, the library, lecture capture, Teams, Zoom and others. It then calculates daily Engagement Ratings for you based on how much you've interacted with these digital education systems. This learning analytic can help you to understand how you are engaging with your digital learning.
Whether you're tech-savvy and looking to optimise your online learning or simply curious about your digital learning patterns, your analytics in StREAM@Leeds can provide you with this insight. You can use the system to begin to understand how your digital engagement supports your learning. This guide provides you with an overview of the information you'll see when you login and how you might use that information to get insights into your digital engagement.
 Throughout this guide, we'll include links to further reading in case you want to delve a little deeper into what you can see when you use StREAM@Leeds, or to get a better understanding of how it is being used to support you throughout your studies.
How you can use StREAM@Leeds
StREAM@Leeds is designed for students. It can assist you in reflecting on the way you engage with your studies. You can use these insights to explore how your engagement activities are impacting your learning.
It's important to remember that whilst StREAM@Leeds provides insight into your engagement with certain digital education systems and resources, these analytics should not be considered in isolation as an indicator of how well you are engaged with your studies. During your studies you will engage in many ways that are not visible purely through the systems analysed by StREAM@Leeds, for example your contribution during in-person teaching, placements and so on.
In case you want to discuss your learning analytics with your Academic Personal Tutor, they can also see your StREAM@Leeds Dashboard, with a view to making it easier to have discussions around your digital engagement.
Further reading
- Academic Personal Tutoring Guides - find guides that cover essentials such as, why you have an Academic Personal tutor, how to find your APT workbook and more.
Now let's take a look at the information you'll find when you login to StREAM@Leeds and view your StREAM@Leeds Dashboard.
How to login to StREAM@Leeds
- To view your StREAM@Leeds Dashboard go to StREAM@Leeds and log in using your university username and password. You may be asked to complete Duo-Factor authentication.
When you first login you’ll notice your Dashboard has a header at the top and six tabs that run below the header. The header remains at the top of your Dashboard even when you switch between tabs.
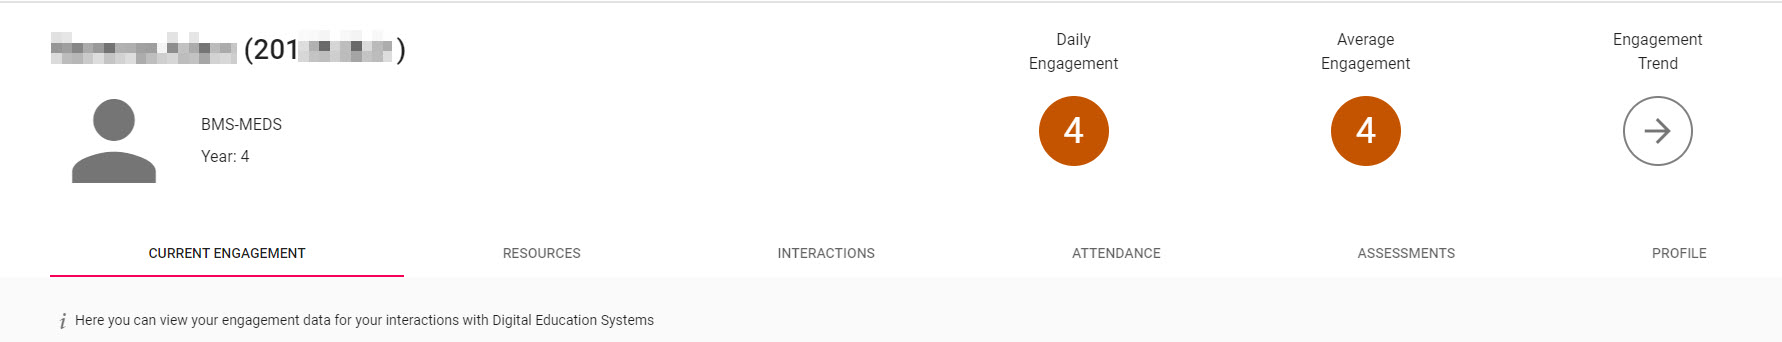
The header displays:
- your name, year of study and programme code
- your daily and average Engagement Ratings
![]() Before we go on to look at what each of the tabs show, let's take a closer look at what Engagement Ratings are, how they are calculated and how they are used. These are a key learning analytic used to measure your digital engagement and you'll notice that they are visible in a number of areas within StREAM@Leeds.
Before we go on to look at what each of the tabs show, let's take a closer look at what Engagement Ratings are, how they are calculated and how they are used. These are a key learning analytic used to measure your digital engagement and you'll notice that they are visible in a number of areas within StREAM@Leeds.
What are Engagement Ratings and how are they calculated?
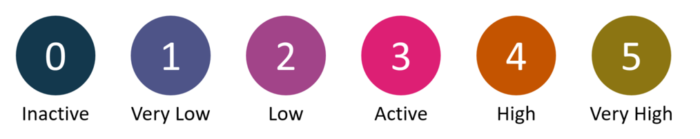
StREAM@Leeds calculates daily Engagement Ratings for you based on how much you've interacted with key digital education systems. These Engagement Ratings are: Inactive (0), Very Low (1), Low (2), Active (3), High (4), Very High (5).
While these ratings are calculated daily, they consider activity from the last 7 days for full-time students and from the last 21 days for part-time students. This ensures that they do not fluctuate dramatically each day. For a full-time student, this means that if you have engaged at a high level between Monday and Friday but stop engaging on the weekend, you won't suddenly drop into the Inactive (0) category if you re-engage on Monday.
Engagement Ratings are used to help identify students who may benefit from support (we look at this in more detail, in the How StREAM@Leeds is used to support you section further down this page). For example, if a full-time student has Inactive (0) Engagement Ratings for 7 consecutive days, Notifications are used to flag this.
You will be able to see if you’ve triggered a Notification within StREAM@Leeds, which gives you the opportunity to introspect on your learning in the last 7 days. For part-time students, Notifications will trigger after 14 days instead of 7. We'll look closer at Notifications further down the page.
Context is very important when looking at your data. If your Engagement Ratings are on the lower end, this does not always mean your level of interaction is a problem. We recommend checking your Cohort average to get a sense of how you are engaging in comparison with peers on the same programme of study. We’ll look at where you can find your Cohort average further down this guide.
What do each of the tabs on my Dashboard show?
Now that we've covered Engagement Ratings, let's move onto what you'll see when you look at your Dashboard.
Each of the tabs below the header on your Dashboard provide different information. Let's look at each one to understand why you might refer to them. Your most likely to refer to the CURRENT ENGAGEMENT tab and this is the one you'll see first by default when you login.

CURRENT ENGAGEMENT
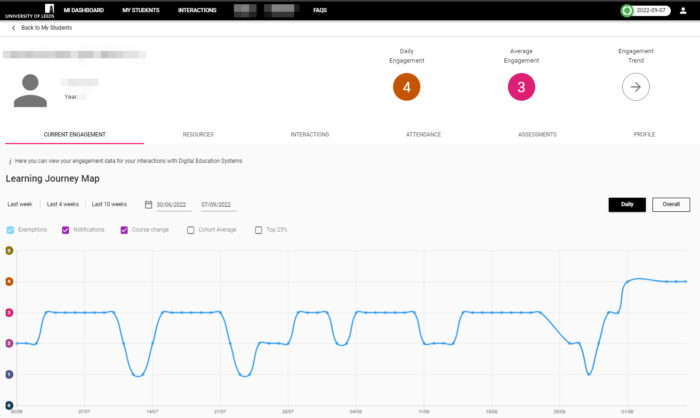
The CURRENT ENGAGEMENT tab summarises how you have been engaging with digital education systems and resources through various charts and graphs.
By default it will show you information based on the last 4 weeks, you'll have the option to set a date range or use one of the date selectors to see the dates you are interested in (e.g. Last week).
The Learning Journey Map graph on this tab is a key view of your learning analytics. You'll see a few different things plotted on this graph:
You will see how your Engagement Ratings change over time (plotted as a solid blue line). By default you'll see the last four weeks of engagement. For example, 3rd October, Engagement Rating 3, 4th October, Engagement Rating 4 and so on.
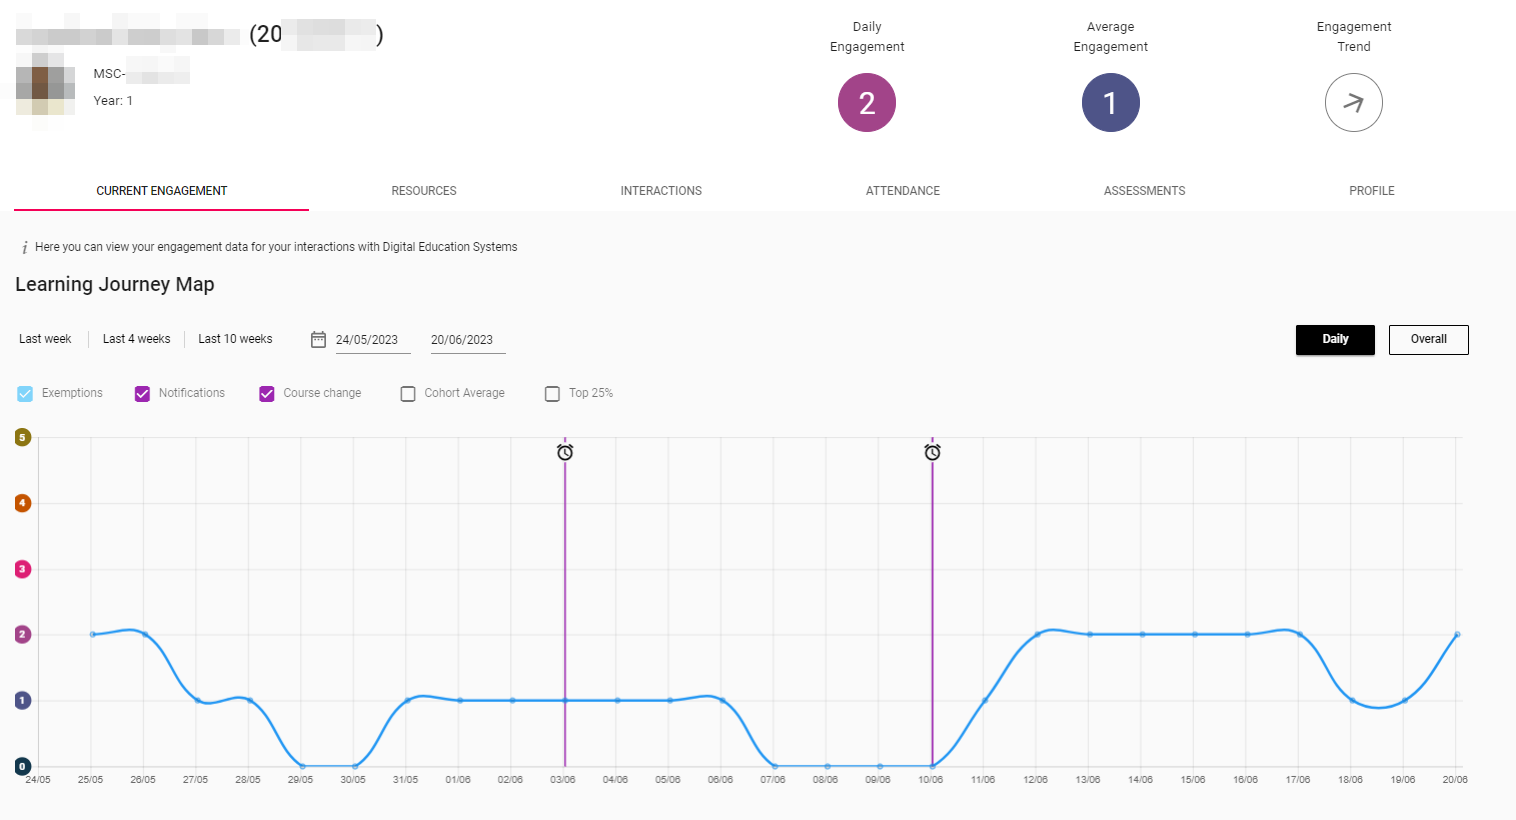
![]() If you have no digital Engagement, or low digital Engagement Ratings for 7 consecutive days (14 days for part-time students) you will trigger a Notification within the system. This will be indicated by a purple clock icon on the graph against the date it was triggered. The system does not automatically email you if you trigger a Notification. It is registered in the system and SES staff who support digital engagement monitoring will be able to see that this has happened. They may then reach out to you to offer support and advice. To learn more about Notifications see, What are Notifications?
If you have no digital Engagement, or low digital Engagement Ratings for 7 consecutive days (14 days for part-time students) you will trigger a Notification within the system. This will be indicated by a purple clock icon on the graph against the date it was triggered. The system does not automatically email you if you trigger a Notification. It is registered in the system and SES staff who support digital engagement monitoring will be able to see that this has happened. They may then reach out to you to offer support and advice. To learn more about Notifications see, What are Notifications?
How using the Cohort Average can help you to understand your digital engagement
Context is very important when looking at your data. If your Engagement Ratings are on the lower end, this does not always mean your level of interaction is a problem. We recommend checking your Cohort Average to get a sense of how you are engaging in comparison with peers on the same programme of study. Depending on the way your course is structured you may not have high Engagement Ratings each day.
The Cohort Average shows the average engagement of students studying the same programme as you. This can help you to understand where your engagement patterns differ from the rest of your cohort. You can view your Cohort Average by checking the Cohort Average option just above your Learning Journey Map. This will add a red, dotted line to the map to show your cohort's average alongside your engagement (which is indicated by the blue solid line).
In instances when your Engagement Ratings drop or aren't quite at the same level as your peers, you should consider whether this is a result of any external circumstances you have experienced.
Whilst the Cohort averages on the engagement line chart shown on your StREAM@Leeds dashboard are calculated using data from you and your course mates, this will only be an aggregate value, there will be no way for someone to identify your or any other individual student’s individual engagement rating.
It is important to remember that seeing that you have high or low Engagement Ratings will only tell you so much, and it will be up to you to reflect on your own studies to see whether you are truly engaging on your course.
Further reading
- The CURRENT ENGAGEMENT tab also has an Engagement Breakdown pie charts and a calendar view of your daily Engagement Ratings, if you want to learn more about these, see: What does the Current Engagement tab show.
RESOURCES
Selecting the RESOURCES tab allows you to view the individual interactions you have had with the digital education systems and resources StREAM@Leeds collates data on, over a period of time.
This tab is made up of a number of Resource Cards, each card contains a line chart, showing which digital resource you have used and when you used them. The number in the bottom right of each card shows the total number of interactions you have with that system or resource.
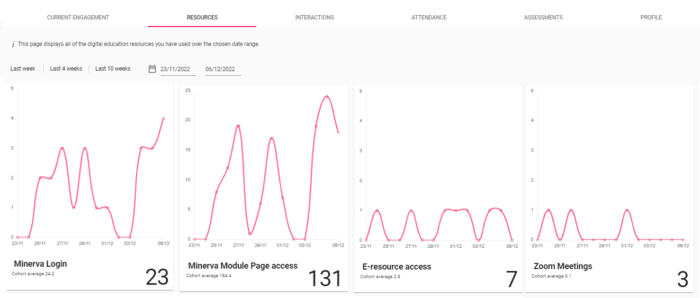
By default this tab will show you information based on the last 4 weeks, you'll have the option to set a date range or use one of the date selectors to see the dates you are interested in (e.g. Last week).
Further reading
- The RESOURCES tab also displays a pie chart below the Resource Cards, this provides detail on how each of the systems are weighted when calculating your Engagement Ratings, to learn more about this see: What does the Resource tab show.
INTERACTIONS
The INTERACTIONS tab displays a list of any Notifications you have triggered, and any Exemptions that have been applied.
- For any Notifications you have triggered you will see:
- The date the Notification was triggered.
- Details of the type of Notification (No Digital Activity/Low Digital Activity). Your school and faculty code is included in these details,
- For any Exemptions that have been applied you will see:
- The start and end date of the Exemption.
- The reason for the Exemption e.g. Placement, Authorised Absence
Exemptions can be created for a defined period of time if a student is not expected to engage with digital education systems for a particular reason (e.g. placement). If an Exemption is added by school staff, this will prevent the student from triggering Notifications.
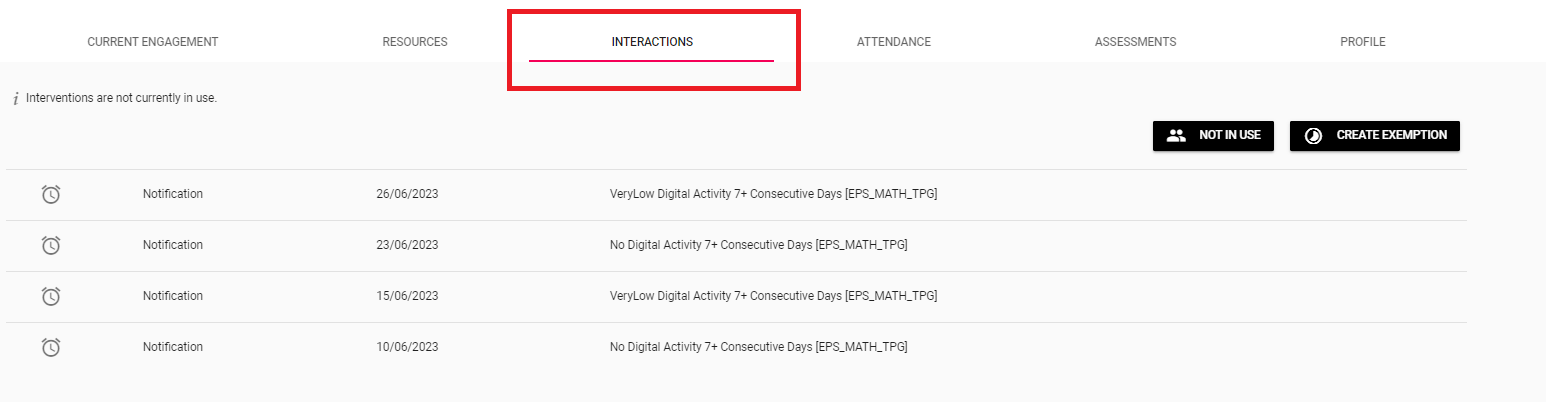
Whilst the Learning Journey Map graph on the CURRENT ENGAGEMENT tab presents this information in the form a graph and icons, the INTERACTIONS tab shows it as a list. You may find the list easier to refer to if you want to look back.
Further reading
Questions about what you see on this tab?
Notifications and Exemptions are set up and managed the Student Education Service Team within your school. If you have any questions about the Notifications or Exemptions displayed within this tab please contact your school's Student Education Service team.
Exemptions can only be added by staff within your school's Student Education Service team who are involved in digital engagement monitoring.
ATTENDANCE
The ATTENDANCE tab is not currently in use at Leeds. Each school manages attendance outside of StREAM@Leeds. Physical attendance is not used by StREAM@Leeds.
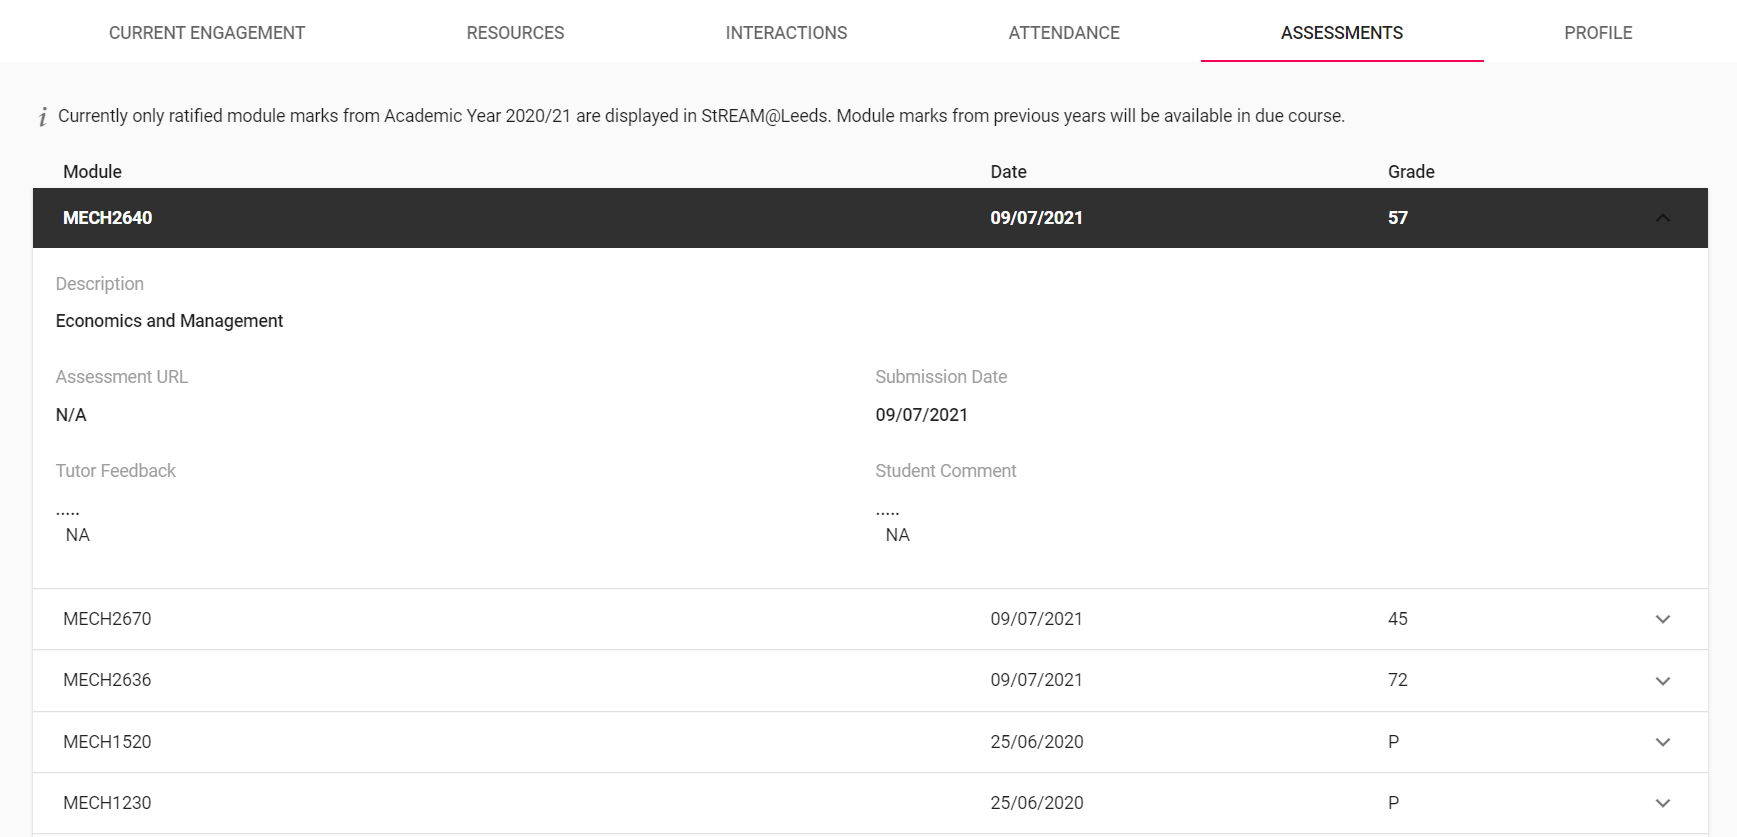
ASSESSMENTS
If you are in your first year of study this tab will be blank for you until you move into level 2 of your studies. This tab is usually updated in October each year.
- Module code
- The date the grade was ratified
- The grade (typically a numerical grade but can also be P or F for pass/fail modules)
Clicking the down arrow to the left of a grade will provide the module name and additional information.
Your Academic Personal Tutor may refer to this tab to better support you during your Academic Personal Tutoring meetings.
Further reading
- Academic Personal Tutoring Guides - find guides that cover essentials such as, why you have an Academic Personal tutor, the system you need to use to access your APT workbook and more.
PROFILE
The PROFILE tab contains a number of cards with information about you, e.g. your programme of study, email address etc. It also shows who your Academic Personal Tutor is should you wish to contact them.
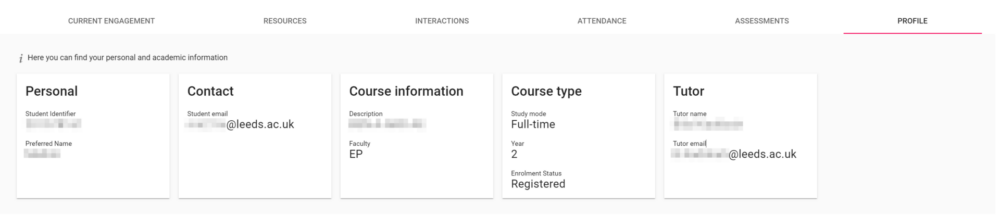
Your Academic Personal tutor may refer to this tab to learn more about you, i.e. what you are studying, what your current year of study is, whether you are a full-time or part-time student and so on.
If you have recently changed course and the Course Information on this tab still shows your old course details two weeks after the change, please create a ticket via the IT website to report this so that we can arrange for StREAM@Leeds to be updated for you.
Further reading
- Academic Personal Tutoring Guides - find guides that cover essentials such as, why you have an Academic Personal tutor, the system you need to use to access your APT workbook and more.
How your StREAM@Leeds data is used to support you

The Student Education Service team in your school monitor engagement. If your Engagement Ratings drop below certain thresholds, the team monitoring engagement are able to see the Notifications that are triggered in StREAM@Leeds as a result. They may then reach out to discuss your engagement with you. However, this is with a view to providing you with support that can help your studies and is not meant to be punitive.
Staff managing digital engagement monitoring processes are aware that StREAM@Leeds shows only a snapshot of your interactions with certain systems and resources, and does not show how you may be engaging with your studies in other ways. It is used simply as an indicator of your digital engagement so that support can be offered.
Related Guides
- What is digital engagement?
- I've logged in and my data doesn't look right: see, How do I login to StREAM@Leeds for guidance on how to check your learning analytics data is up to date.
- What are Notifications?
- Who can see my StREAM@Leeds Dashboard?
- A to Z of StREAM@Leeds Student Guides